Active Campaign — Spring 2026

Our streets were built for neighbors, not commuter shortcuts (see study)

Over 10,000 cars a day travel through the Lower Rockridge Trapezoid. After 15+ years of residents lobbying the City, years of studies, 2 petitions with hundreds of signatures requesting traffic volume reduction, 2 years of meetings, it's time for action.

Overall Volume
10,000
cars per day through the Lower Rockridge trapezoid
2× – 8× over safe traffic limits
Our streets are massively overused, primarily by cut-through traffic.
Traffic Pilot Goal
Reduce traffic by a minimum of 60%
cutting through the Lower Rockridge trapezoid
"Local streets should be used primarily for access to abutting property. Their design should discourage all through traffic." — Oakland General Plan, Circulation Element
1,000,000
cut-through cars per year we aim to eliminate from our streets in the Lower Rockridge trapezoid

A neighborhood vision guided by noble principles

Preserve and improve neighborly character

Residential street with pedestrians and a cyclist — neighborly character

Enhance residents' safety

  • Make parents and children feel more comfortable they can walk to school and play on the street
  • Improve air quality by reducing exhaustion from cars, especially idle ones at intersections
  • Reduce crime by preventing "quick get-aways"
Cyclists and pedestrians on a slowed residential street — residents' safety

Foster walkability and bike-friendliness

Slow Neighborhood sign with cyclist and outdoor cafe — walkability and bike-friendliness

Navigation apps turned our neighborhood from residential to thoroughfare

The Rockridge "trapezoid" — the residential area bounded by College, Claremont, Telegraph, and Alcatraz Avenues — has become a major cut-through corridor. Waze, Google Maps, and gig-economy routing send thousands of commuter vehicles daily onto streets never designed for that volume.

⚠️

Children at Risk

There's a preschool on Colby Street. During rush hour, up to 400 cars per hour can race past — residents can't safely exit their driveways, and families can't safely cross the street.

🚲

Bike Boulevard Failure

Colby is Oakland's designated bicycle boulevard — a primary bike corridor connecting neighborhoods across North Oakland and South Berkeley. NACTO guidance establish as a ceiling 50 cars per hour and 2,000 per day on a bike boulevard. During rush hour we hit 400 — 8× the hourly limit — and daily volumes reach 4,000, 2× the daily threshold.

🏗️

It's About to Get Worse

The new Jewish Community Center (JCC) facility will generate up to 338 additional peak-hour vehicle trips — source: California Environmental Quality Act (CEQA) study conducted as part of the JCC remodel permitting process. Waymo is coming to Oakland in 2026. New developments on College Ave will add even more.

📱

App-Driven Volume

The vast majority of traffic on Colby and Hillegass is cut-through — drivers following navigation apps like Waze and Google Maps that route them through residential streets to shave time off their commute.

Traffic volume is far beyond safe limits, especially on the North-South axis

This isn't anecdotal. It's been measured by community traffic counters, confirmed by OakDOT surveys, and modeled by career-long experts on California traffic using professional modeling tools.

Average Daily Traffic (ADT) — Current Measured vs. Safety Standards

FHWA local: 700
FHWA bike: 2,000
Colby Street
~3,500
Colby (w/ JCC)
5,000+
Hillegass Ave
~1,900
Hillegass (w/ JCC)
~2,400
Martin Street
~2,000
Martin (w/ JCC)
~2,300
0
1,000
2,000
3,000
4,000
5,000
vehicles per day →
Street Measured ADT Max Threshold Status
Colby St (bike boulevard) ~3,500 2,000 (FHWA and OakDOT bike route) 175% over limit
Colby St (projected w/ JCC) 5,000+ 2,000 (FHWA and OakDOT bike route) 250%+ over limit
Hillegass Ave ~1,900 700 (FHWA local street) 271% over limit
Hillegass Ave (projected w/ JCC) ~2,400 700 (FHWA local street) 343% over limit
Martin St ~2,000 700 (FHWA local street) 286% over limit
Martin St (projected w/ JCC) ~2,300 700 (FHWA local street) 329% over limit
Sources: Community Telraam traffic counters (continuous); OakDOT survey data; FHWA residential street guidelines (1,500 ADT max for residential streets); OakDOT standard (2,000 ADT max for bike routes, 50 vehicles/hr/direction at peak); Fehr & Peers CEQA study for JCC East Bay project.

A proven, affordable, reversible pilot

OakDOT Director Josh Rowan designed a diverter-based pilot project — the standard traffic engineering tool used worldwide for exactly this problem.

Colby Current Traffic (Peak Hour)
433
vehicles/hour
−60%
With Diverter Pilot
173
vehicles/hour — within safe limits
Hillegass Current Traffic (Peak Hour)
334
vehicles/hour
−60%
With Diverter Pilot
134
vehicles/hour — within safe limits
🔧

Tactical & Reversible

3-month pilot using posts, paint, and planters. Nothing permanent. No concrete. Can be adjusted or removed based on measured results.

💰

Budget: $40,000

Extremely affordable by city infrastructure standards. Planters are already in the city's possession.

🌍

Standard Practice

Diverters are used in Paris, Bologna, London, and Berkeley (just blocks north across Alcatraz). This is not experimental — it's proven urban design.

🏙️

Modern Urban Design

Inspired by Barcelona's superblocks — a proven model that reclaims residential streets from through-traffic, reducing noise and pollution while creating safer, more livable neighborhoods. Cities worldwide are adopting this approach.

Pilot first things first

Diverter-based pilot proposed by OakDOT is the most impactful on traffic and most effective use of taxpayer dollars.

Treatment Impact on Traffic Volume Affordability Effectiveness (Impact × Affordability)
Diverters
Physical barriers (planters, bollards) allowing walking, biking
65%
★★★★☆
260%
Cul-de-sacs / Dead-end Street Networks
Terminates street connectivity for cars while keeping pedestrian/cyclist access
45%
★★★☆☆
135%
Turn Restrictions / Vehicle Access Controls
Regulatory limits (e.g., no left-turns into, residents-only access windows)
40%
★★★★★
200%
Road diet
Reduce the number or width of travel lanes
25%
★★☆☆☆
50%
Traffic circle
Raised or painted circles at intersections to slow traffic
20%
★★☆☆☆
40%
Speed hump/table
Vertical deflection devices placed mid-block
15%
★★★★☆
60%
already in place
Chicanes
Alternating curb extensions or parking shifts creating an S-curve
10%
★★☆☆☆
20%
Curb extension
Tightened corner radii and shorter crossings
5%
★★☆☆☆
10%
Signage only
Posted signs without physical enforcement
3%
★★★★★
15%
Red line indicates 100% effectiveness threshold
Source: Traffic Treatments Effectiveness. Treatments above the 100% effectiveness threshold deliver outsized value per dollar.

Claims vs. evidence

Misinformation has circulated in the neighborhood. Here's what the data and OakDOT's own assessments actually show.

Claim

"The pilot is a bait-and-switch and will remain permanent"

Evidence

The pilot is a first measure, reversible if deemed ineffective, of a multi-year process to try out other measures and ultimately squeeze cut-through traffic out of the trapezoid altogether.

Claim

"Diverters don't reduce traffic"

Evidence

Modal filters such as bollards, boom barriers, and planters are cheaper and work better than speed bumps and typically achieve 60% traffic volume reduction, e.g. Portland, OR, San Francisco, CA, and London, UK.

Claim

"Better solutions have been identified"

Evidence

"Overall, I would deem the [work group] effort to be a failure [...]. During the process, some good ideas were developed that warrant consideration from the neighborhood. These ideas are not really what I would consider a 'pilot.'" — Josh Rowan on 04/19/2025

Claim

"This will just push traffic to other streets"

Evidence

Traffic modeling by career-long experts on California traffic using professional modeling tools estimated ~60% reduction in cut-through traffic, an impact consistent with similar pilots both far away, in Portland, OR, London, UK, and next door, in Berkeley on the other side of Alcatraz Avenue — see references on Appendix page.

Claim

"The community rejected diverters"

Evidence

"Some members of [the working] group chose to bypass the established process and work directly with my engineering staff. This was an act of bad faith..." — Josh Rowan on 04/19/2025. "I did not unequivocally take diverters off the table" — Josh Rowan on 08/19/2025.

15+ years of advocacy, 3 years of studies, meetings, and delays

Residents have been asking for help since 2007. The data is in. The solution is designed. What's missing is implementation.

2007
Trapezoid residents advocate for traffic volume reduction
Residents started organizing, working with then Council Member Jane Brunner and staffer Zac Wald. Informal traffic volume count at the time indicated ADT on Colby approaching 2,000. OakDOT installed speed bumps over several years, which, while appreciated and resulting in speed reduction, did not stop the progressive increase of traffic volume.
2014
Safeway redesign increases traffic volume
After significant community engagement prompted by Safeway redesign, residents secured rights to traffic mitigation funds for traffic calming. While Safeway ended up agreeing to provide funds, the City dropped the ball in securing the funds. OakDOT commissioned survey showing traffic volume on Colby increased to 2,300 ADT.
2020
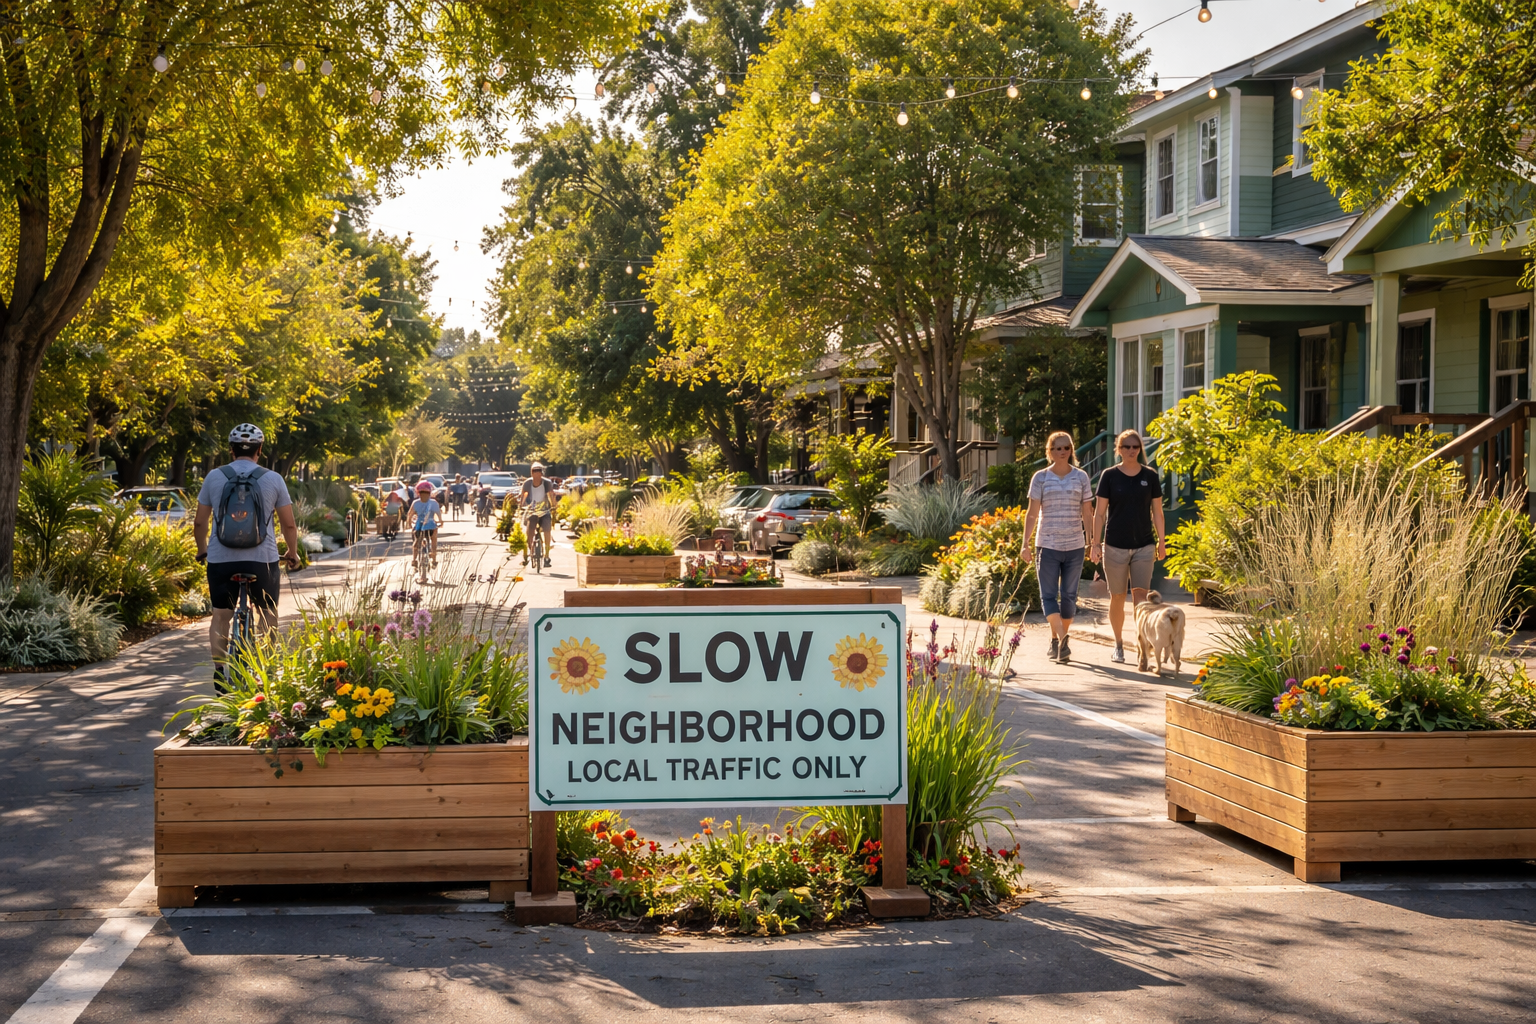
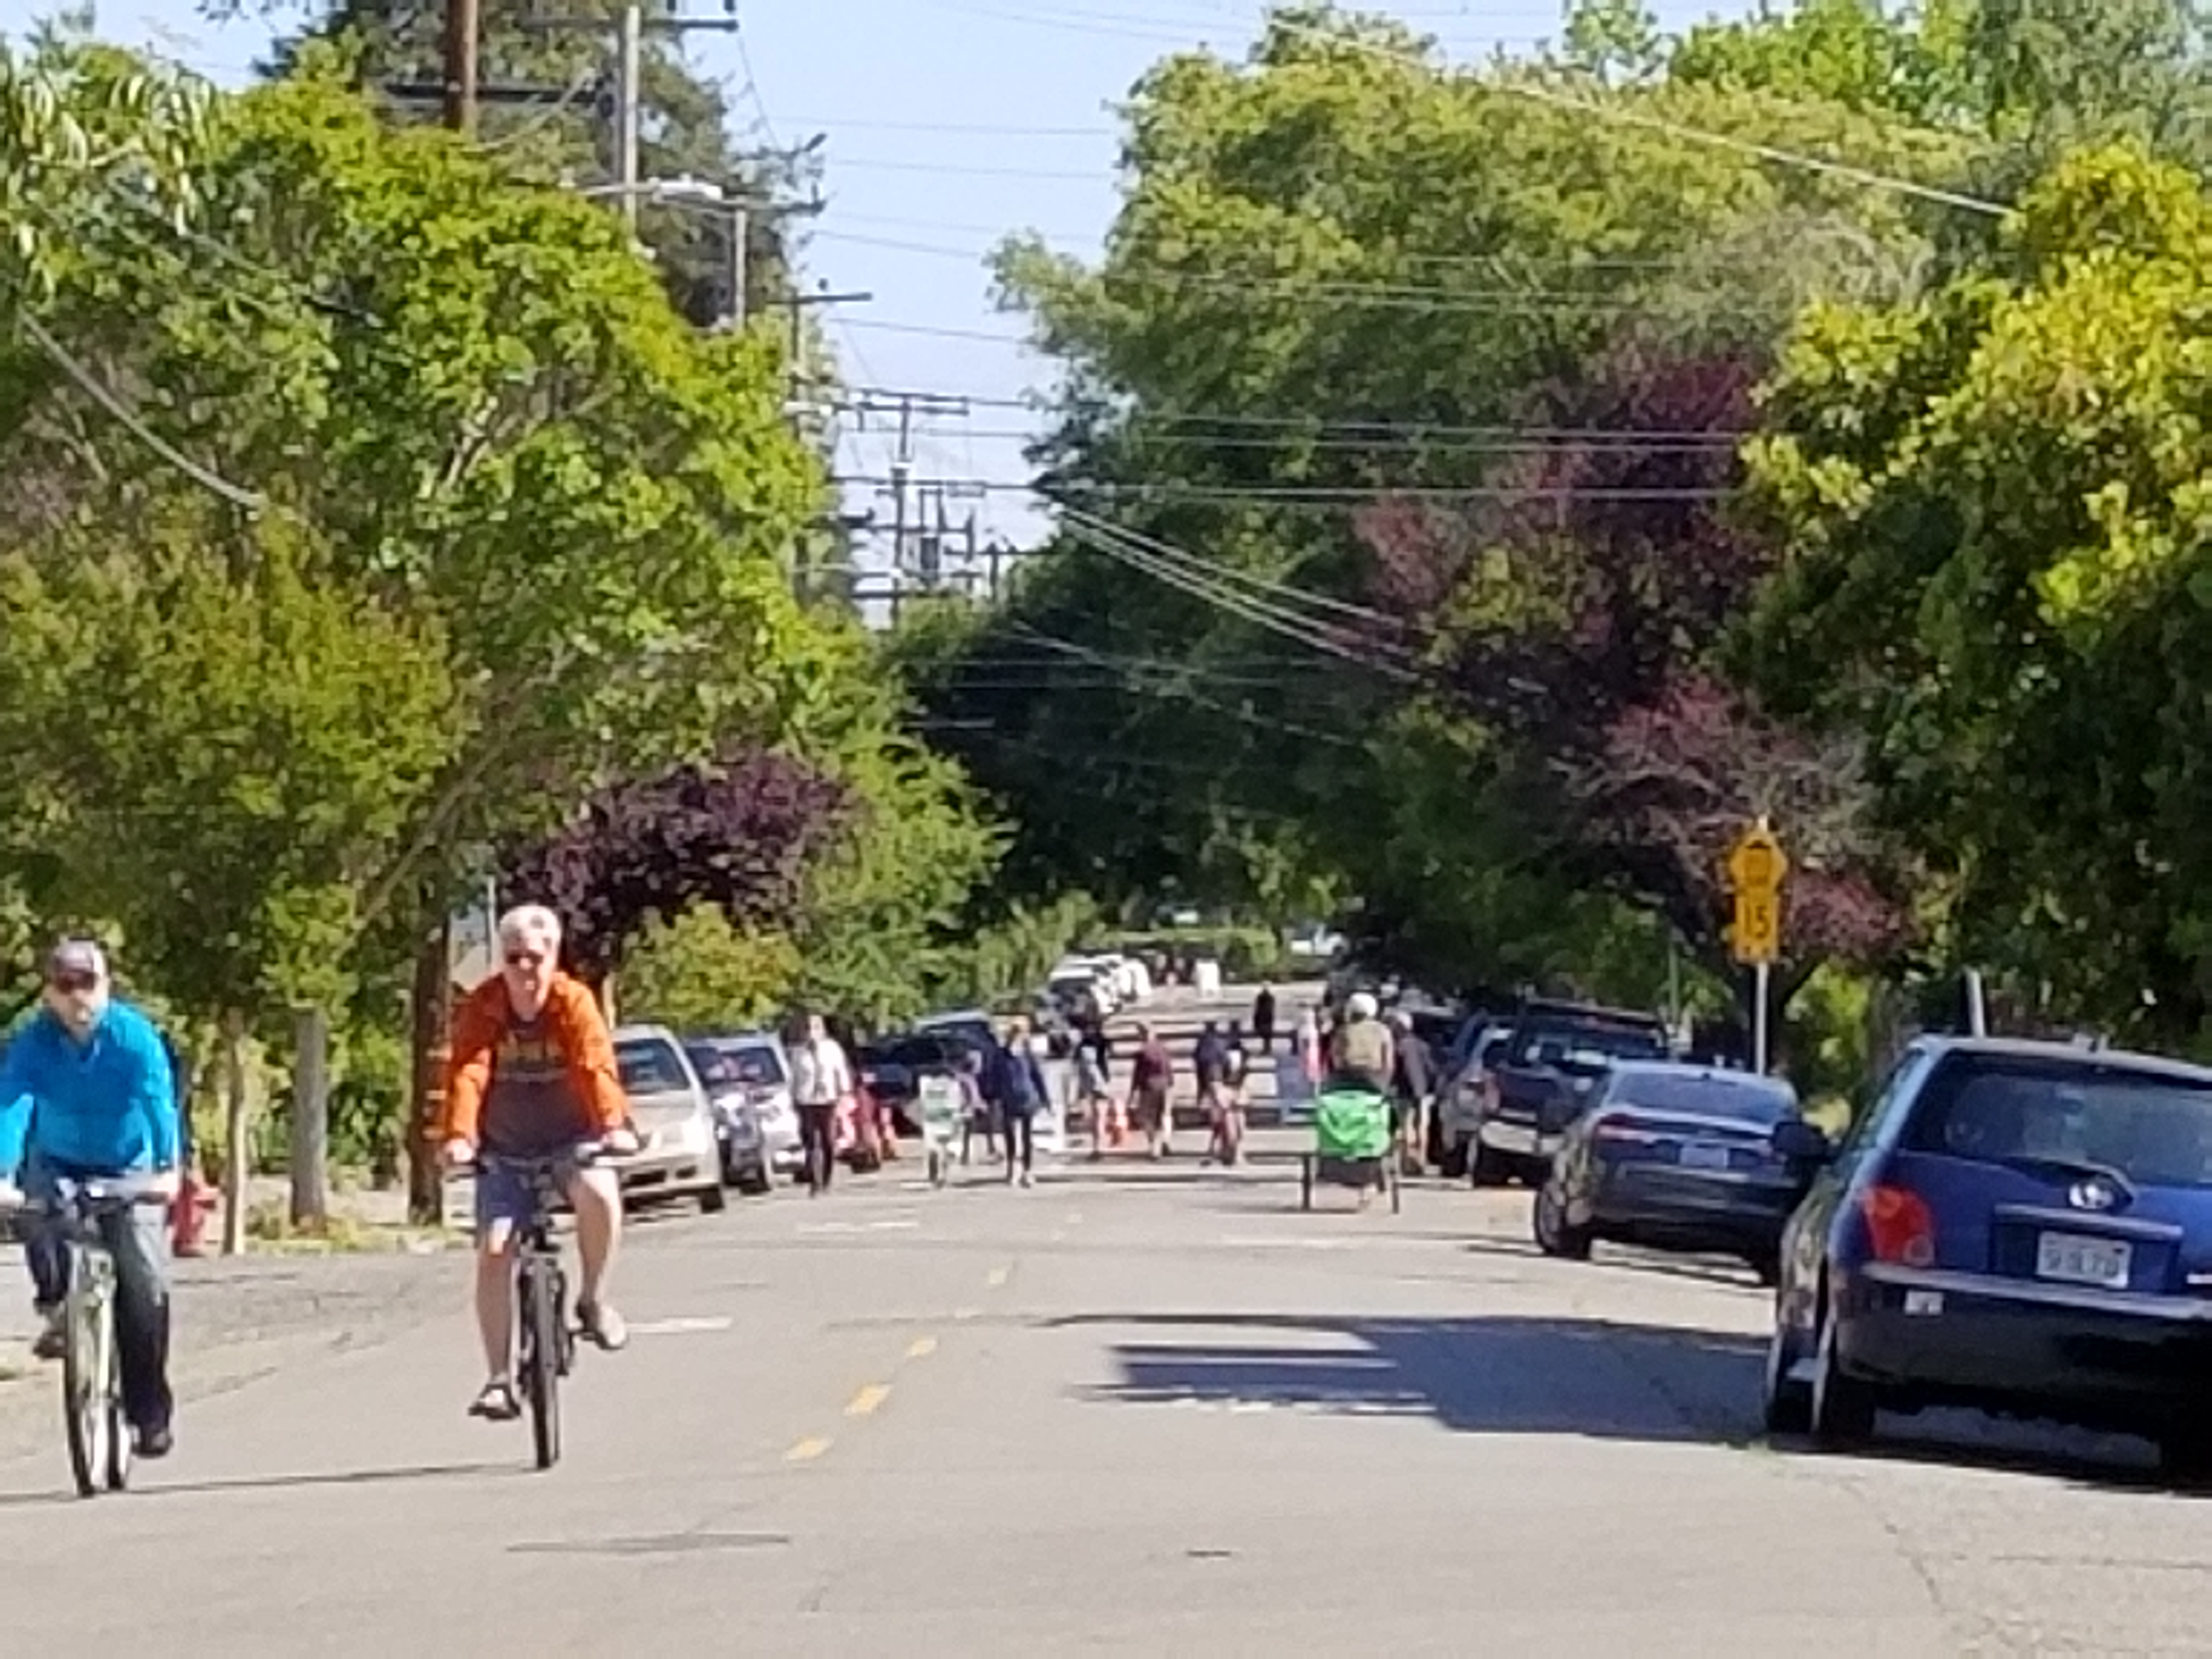
COVID leads to Slow Street program
Mobile diverters led to significant traffic volume drop and a new neighborly feel, prompting 250+ widespread residents to sign a petition to make the Slow Street program permanent.
April 2023
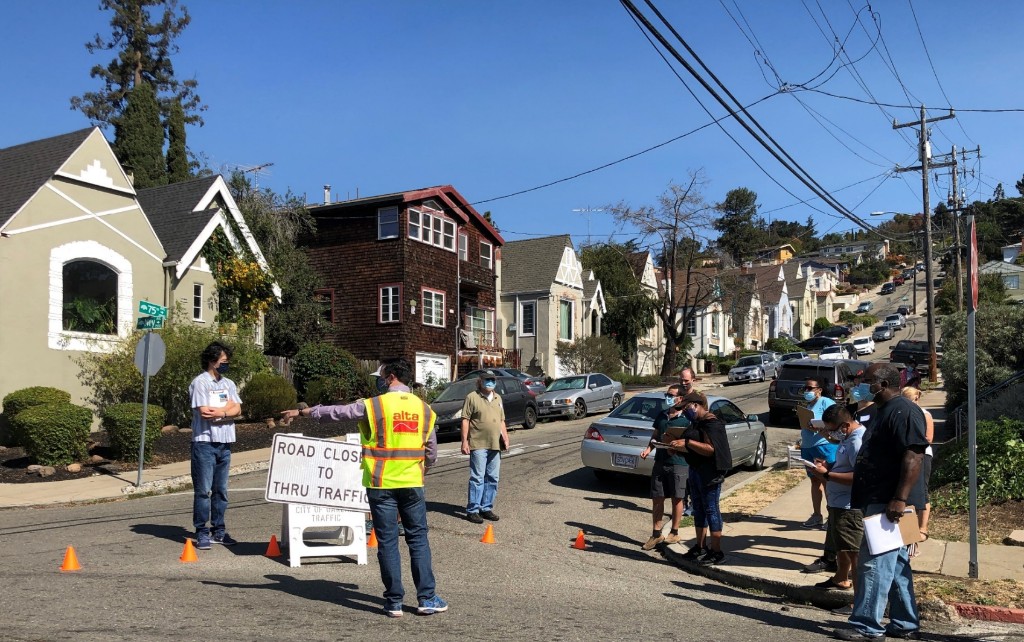
First official walkthrough
45+ Hillegass neighbors met with Councilmember Dan Kalb. OakDOT staff walked the neighborhood.
November 2023
Petition to City Administrator
Residents formally requested physical enhancements including diverters.
March 2024
OakDOT proposes traffic volume reduction pilot
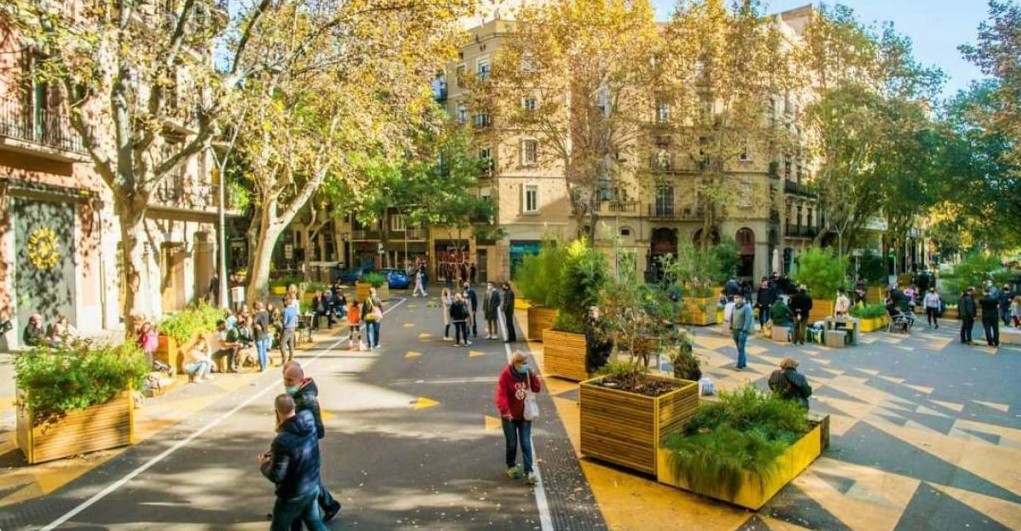
Mainstream adoption of navigation apps accelerates cut-through traffic across neighborhoods, nationally and in the Trapezoid. OakDOT renews its "commitment to promoting people over cars" and defines goal of Pilot as "intended to discourage traffic from treating this neighborhood as a shortcut". OakDOT proposes multi-year process to drain cut-through traffic out of the Trapezoid, starting with a 3-diverter based pilot over 18 months.
December 2024
Community meeting — pilot paused
100+ residents attended. Some neighbors objected. Director Rowan agreed to a Working Group to explore alternatives.
Jan–Mar 2025
Working Group meets six times
Data was shared including career-long experts on California traffic using professional modeling tools (60% traffic reduction) and JCC CEQA projections. No consensus on alternative.
April 2025
Working Group disbanded
Director Rowan cited "bad faith" conduct by opposition members who bypassed the established process. No alternative to diverters was produced.
June 2025
Private meeting excludes pilot supporters
Councilmember Unger and Director Rowan attended a meeting hosted by a former Councilmember — no pilot supporters were invited.
November 2025
Pilot supporters meet with City leadership
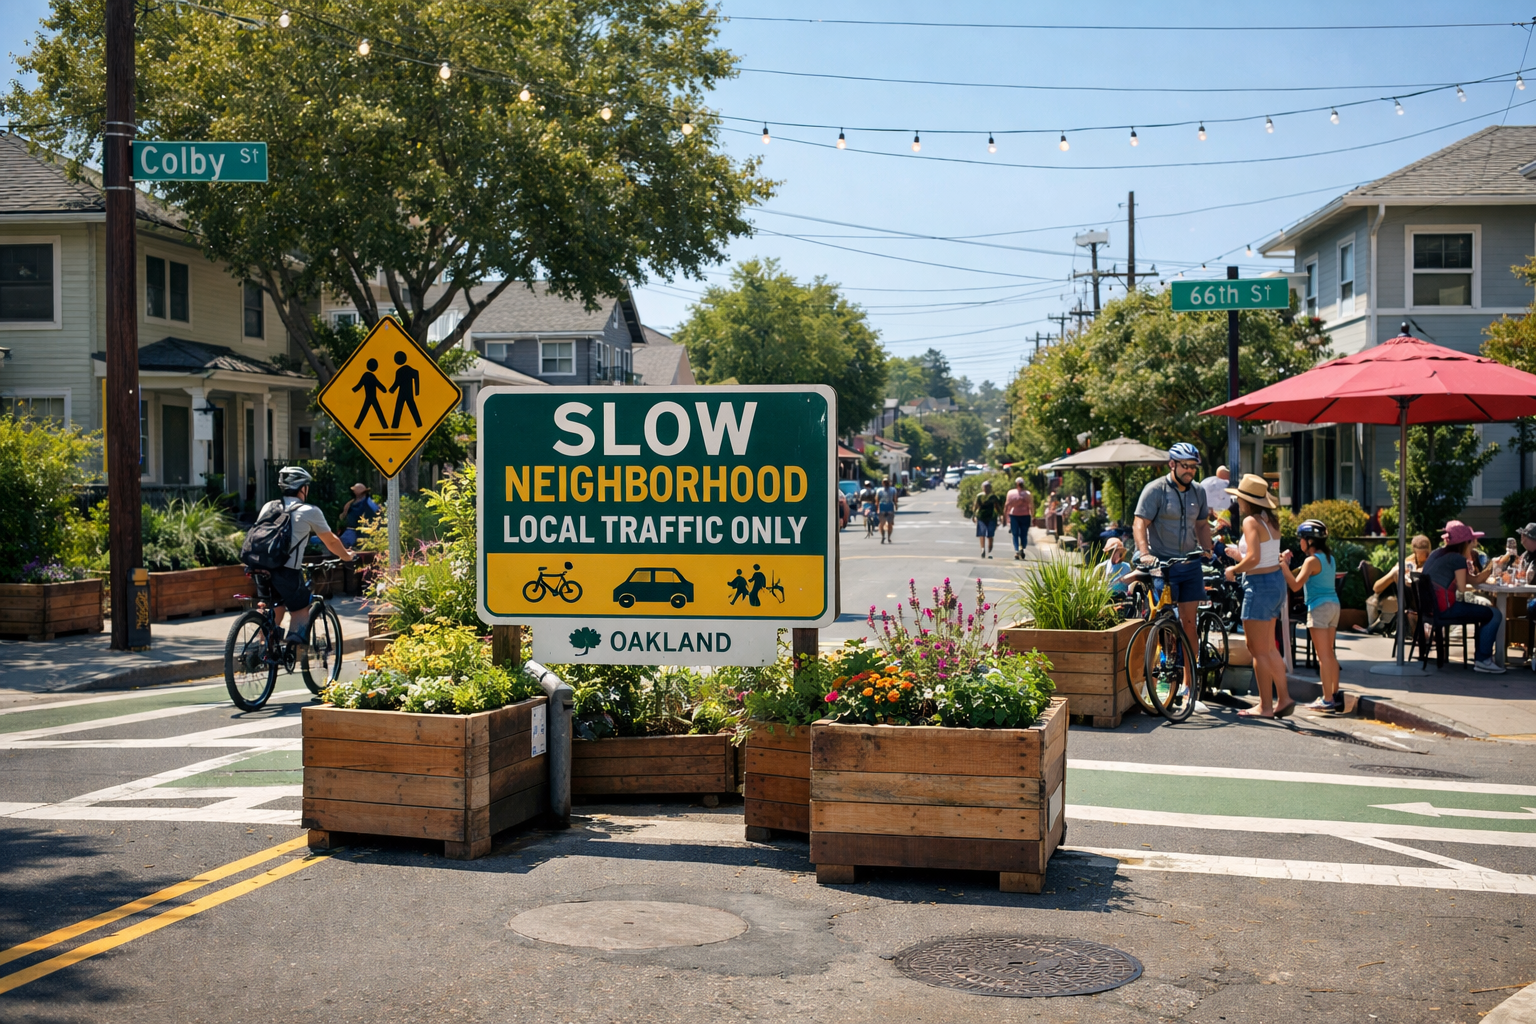
Pilot supporters met with City Administrator, Councilmember Unger, and Director Rowan to present the case to take action and implement a pilot, including signage supporting the pilot on targeted streets — Colby, Hillegass, and 62nd as well as the Wormhole.
Aug 2025 – Jan 2026
Six months of silence
No communication from the City. No community meeting. No pilot implementation. Nothing.
January 2026
Residents press for answers
Councilmember Unger responds that a community meeting is imminent and the city administration is close to a decision.
Spring 2026
Now — time for action
Community meeting expected. We need the City to implement the diverter pilot that OakDOT designed and Director Rowan supported — not a watered-down alternative.

Reference Projects & Studies

These successful traffic calming projects demonstrate proven approaches to reducing cut-through traffic and improving neighborhood safety.

📄

(A) CEQA Analysis: JCC East Bay Project

The JCC remodel will add 338 peak-hour vehicle trips to streets already far over capacity. This Fehr & Peers transportation analysis quantifies the additional traffic burden on College Avenue, Chabot Road, and surrounding residential streets — making the case for diverters even more urgent. Prepared by Lamphier-Gregory, October 2024 (Case PLN23117).

View CEQA Analysis (PDF) →
Barcelona superblock — streets reclaimed for people with planters, pedestrians, and cyclists

(B) Barcelona Superblocks

Barcelona's superblocks achieved a 25% reduction in through-traffic and a 17% decrease in NO₂ pollution by restricting vehicle access to local-only within multi-block zones. Streets formerly dominated by cars became public spaces for walking, cycling, and community life — with no major infrastructure cost. The model is now replicated in cities worldwide.

Barcelona Superblocks — Reclaiming Streets for People →
📊

(C) Traffic Treatments Effectiveness

Diverters deliver 65% traffic volume reduction — the highest of any treatment — and score 260% on combined effectiveness (impact × affordability), far above the 100% threshold. By comparison, signage alone achieves just 3% reduction. Data compiled from FHWA, NACTO, and peer-reviewed transportation research.

View source data → Evaluating the impact of low traffic neighbourhoods (ScienceDirect) →
📋

(D) City of Alexandria Cut-Through Traffic Mitigation Research

Gorove Slade's 2020 report reviews cut-through mitigation programs across nine U.S. municipalities. Key findings: turn restrictions achieved 70–90% traffic reduction in some cases; Waze and navigation apps have exacerbated cut-through issues; jurisdictions often pivot from street-specific to jurisdiction-wide traffic calming when localized mitigations push problems to other neighborhoods.

Read the report (PDF) →
🏫

The "Pride Pilot" (81st Ave)

A 3-week diverter pilot in East Oakland that reduced cut-through traffic by 65–75% using a single diagonal traffic filter. Speeds dropped by up to 4 mph near East Oakland Pride Elementary, and the school principal reported dramatically calmer conditions — proof that diverters work quickly and decisively.

Read the full report →
Oakland road closure sign — Road Closed to Thru Traffic with traffic cones and observers

The "Ney Avenue" Diverter

Oakland's own study showing diverters successfully redirected non-local traffic off residential streets while preserving full access for residents. The physical barriers eliminated shortcutting without displacing meaningful volume to adjacent streets.

Read the study →
Berkeley Bicycle Boulevard Network map

The Berkeley Model (Hillegass Ave)

Just blocks north of our neighborhood, Berkeley used diverters on Hillegass Avenue to keep traffic volumes below 1,500 ADT on their bicycle boulevard. The same street crosses into Oakland and immediately jumps to nearly 2,000 ADT — demonstrating exactly what happens without traffic calming.

Read the guidelines →
🔌

NACTO Case Study: Channing Way Diverter

NACTO documents how Berkeley's Channing Way diverter eliminated cut-through traffic while enabling safe bicycle crossings at a major intersection. The project uses loop detectors and protected platforms — a model for combining traffic reduction with active transportation safety.

View case study →
  1. (1) Traffic counting equipment compiled ADT as ~3,500 on Colby, ~1,900 on Hillegass, and ~2,000 on Martin/Ayala. It is estimated that the other ~12 streets of the trapezoid carry over 2,500 in aggregate.
  2. (2) Lower Rockridge trapezoid is the residential area delimited by 4 avenues — College, Claremont, Telegraph and Alcatraz — with 14 points of entry/exit for car traffic.
  3. (3) 2021 petition requesting the trapezoid to be converted into a permanent slow neighborhood.
  4. (4) 2025 petition requesting a first pilot to reduce traffic volume by leveraging diverters.
  5. (5) Based on career-long experts on California traffic using professional modeling tools and analyzing diverter configurations designed by OakDOT.
  6. (6) Based on OakDOT experience, pilots require a minimum of 12 months or more — 3–4 months for traffic patterns to be rebooted and another 6–9 months to measure impact and take into account seasonal variations (e.g. schools on/off).

Demand immediate action!

Every email matters. City officials have said the silence was being interpreted as fading interest. Let them know that's wrong.

Support the immediate kick-off of the diverter-based pilot OakDOT proposed 18 months ago

Add your name to show city officials this community demands action now.

Traffic counting equipment compiled ADT as ~3,500 on Colby, ~1,900 on Hillegass, and ~2,000 on Martin/Ayala. It is estimated that the other ~12 streets of the trapezoid carry over 2,500 in aggregate. see full footnote (1) ↓
Lower Rockridge trapezoid is the residential area delimited by 4 avenues — College, Claremont, Telegraph and Alcatraz — with 14 points of entry/exit for car traffic. see full footnote (2) ↓
2021 petition requesting the trapezoid to be converted into a permanent slow neighborhood. see full footnote (3) ↓
2025 petition requesting a first pilot to reduce traffic volume by leveraging diverters. see full footnote (4) ↓
Based on career-long experts on California traffic using professional modeling tools and analyzing diverter configurations designed by OakDOT. see full footnote (5) ↓
Based on OakDOT experience, pilots require a minimum of 12 months or more — 3–4 months for traffic patterns to be rebooted and another 6–9 months to measure impact and take into account seasonal variations (e.g. schools on/off). see full footnote (6) ↓
Fehr & Peers study quantifying environmental impact of future JCC facility. View CEQA Analysis (PDF) see full reference (A) ↓
Barcelona's superblocks reclaim residential streets from through-traffic — reducing noise, pollution, and danger while creating public space. Read more see full reference (B) ↓
Comparative analysis of traffic calming treatments — impact, affordability, and effectiveness. Diverters rank highest at 260%. View data see full reference (C) ↓